Monthly Healthcare Industry Financial Benchmarks
November’s Hospital, Patient Volumes, and Physician Practice Financial Performance


This report highlights the latest trends in financial performance for U.S. hospitals and physician groups, drawn from monthly data from more than 135,000 physicians and over 1,900 hospitals.
Despite continued revenue growth and modest inpatient volume gains, elevated hospital and physician practice expenses continued to constrain overall financial performance in November. Highlights from the November 2025 data include:
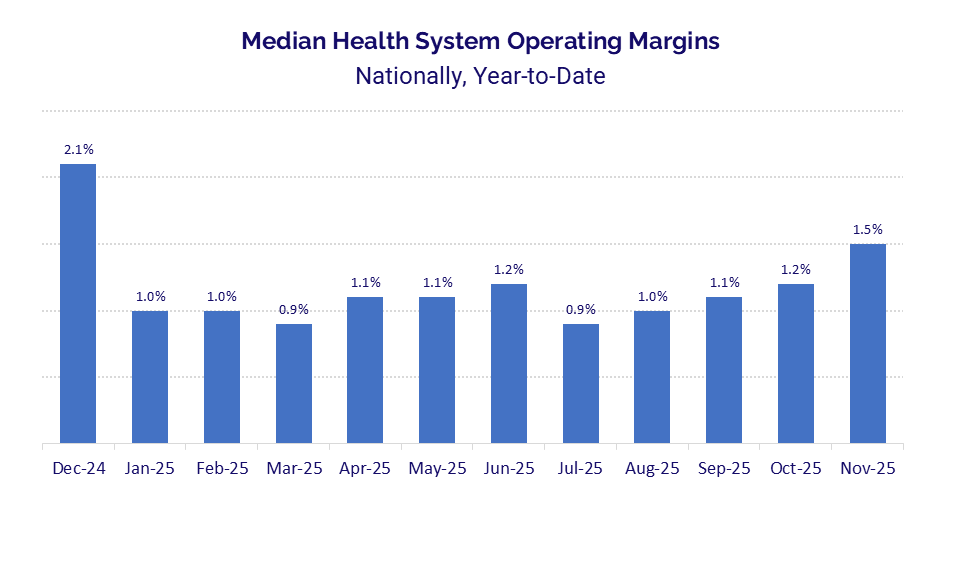
Median health system operating margins rose to 1.5% in November, the largest month-over-month increase of the year and the fourth consecutive monthly improvement.
Hospital expenses remained elevated, with total expense up 5.0% year over year (YOY), driven in part by a 9.3% increase in drug expenses.
Patient volumes were mixed, as inpatient admissions increased 2.0% YOY while outpatient, observation, and emergency visits all declined over the same period.
Hospital revenues continued to grow versus 2024 levels, with gross operating revenue up 5.3%, supported by growth in both outpatient and inpatient revenues.
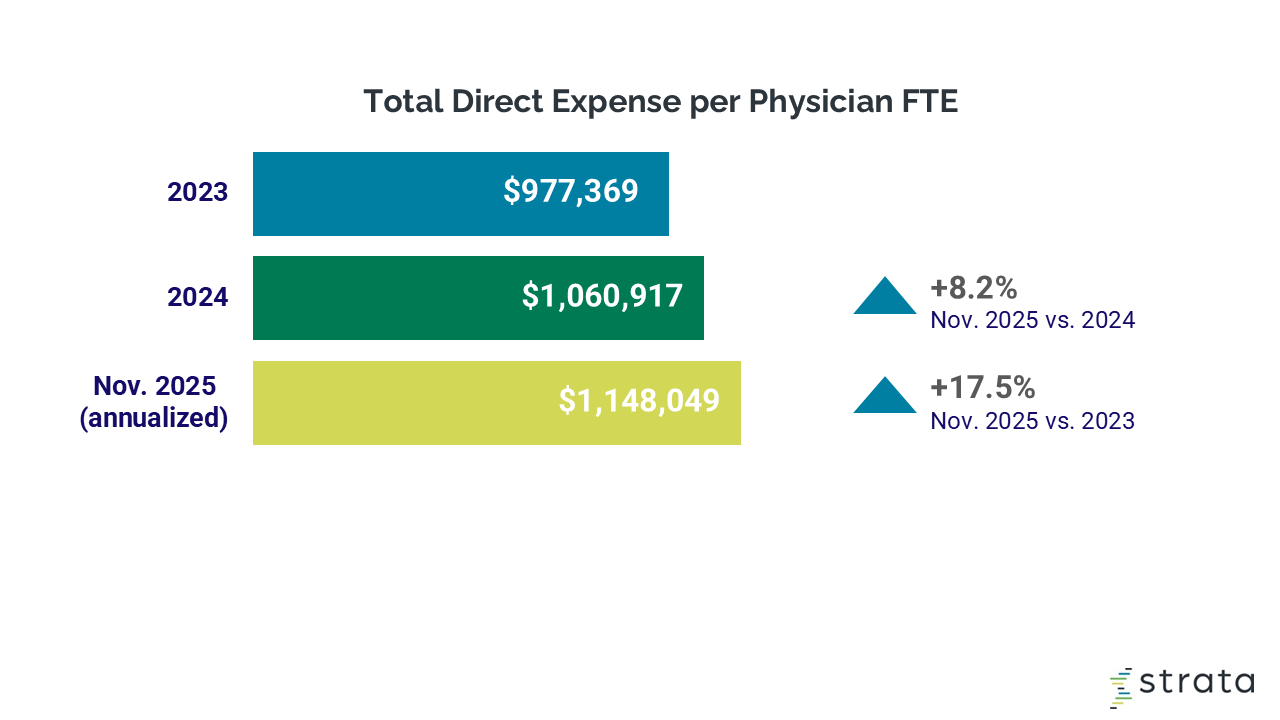
Physician expenses remained on the rise, with median total expense per physician FTE reaching approximately $1.1 million for November annualized, up 8.2% YOY.
The latest benchmarks illustrate the interplay of revenues and expenses on historically tight hospital operating margins.

Operating Margins: U.S. health systems saw continued improvement in operating margins in November, with performance strengthening after margins hovered within just two-tenths of a percentage point of 1% for the first 10 months of 2025. The median year-to-date (YTD) health system operating margin reached 1.5% for the month, up from 1.2% in October. While the increase was modest, it represented the largest month-over-month gain observed so far in 2025 and marked the fourth consecutive month of margin improvement.
At the individual hospital level, however, margin performance was largely stagnant. Nationally, the median change in hospital operating margin declined slightly YOY, down 0.2 percentage point in November. On a month-over-month basis, operating margins fell more sharply, decreasing 3.2 percentage points from October.
Trends in operating earnings before interest, taxes, depreciation, and amortization (EBITDA) margins mirrored these results. The median change in operating EBITDA margin declined 0.4 percentage point YOY and fell 2.9 percentage points month over month.
Regional performance varied. Hospitals in the Midwest and West experienced the largest declines, with median operating margins down 2.5 percentage points in both regions. The metric increased 1.2 percentage points for hospitals in the South and 1.0 percentage points for those in the Northeast.
By hospital size, mid-sized hospitals (100-199 beds) reported the largest decline, with the median change in operating margin down 1.5 percentage points. In contrast, hospitals with 200-299 beds posted the strongest improvement, with the metric increasing 0.8 percentage point YOY.
Hospital Expenses: Overall hospital expenses continued to rise YOY, but decreased month over month. Total hospital expense increased 5.0% YOY in November, driven by a 5.5% YOY rise in total non-labor expense and a 3.6% increase in total labor expense.
Looking at non-labor expenses, drug expense again saw the biggest increase compared to 2024. Drug expense jumped 9.3% YOY, supply expense rose 5.6% YOY, and purchased service expense was up 5.5% YOY. Drug expenses rose YOY for hospitals in all regions, with increases ranging from 1.4% in the South to 11.3% in the Midwest.
From October to November, hospitals saw expenses decline at a national level, with total expense down 5.4%. Total non-labor expense fell 6.8% from October to November, outpacing a 3.0% decrease in total labor expense. Supply and drug expenses posted particularly sharp month-over-month declines, falling 13.2% and 14.8%, respectively.
Expense growth remained elevated after adjusting for patient volumes, reflecting continued pressure from higher expenses per unit of care. Total expense per adjusted discharge increased 5.9% YOY in November, driven by a 6.8% YOY rise in non-labor expense per adjusted discharge. Labor expense per adjusted discharge also increased 3.9% YOY.
Hospital Revenues: Hospital gross revenues again rose above 2024 levels in November. Gross operating revenue increased 5.3% YOY, supported by a 5.5% rise in outpatient revenue and a 6.4% increase in inpatient revenue. Month over month, gross operating revenue declined 10.4%, as outpatient revenue fell 12.4% and inpatient revenue decreased 7.1%.
Outpatient revenues grew across all census regions. Hospitals in the West reported the largest YOY increase at 7.9%, followed by hospitals in the South at 7.4%. Hospitals in the Northeast saw outpatient revenue rise 6.1% YOY, while those in the Midwest experienced a 3.8% increase over the same period.
Revenue performance was mixed on a per-patient basis. Net patient service revenue (NPSR) per adjusted discharge increased 3.3% YOY and edged up 0.2% month over month. In contrast, NPSR per adjusted patient day rose 2.8% YOY but declined 2.1% from October to November. Bad debt and charity care increased just 0.7% YOY in November but declined 7.0% month over month.


Get an in-depth look at current healthcare trends with analyses of financial, operational, and claims data from organizations nationwide, with insights drawn from all of Strata’s datasets.
Hospital inpatient and outpatient volumes are drawn from analysis of more than 10 million patient visits.

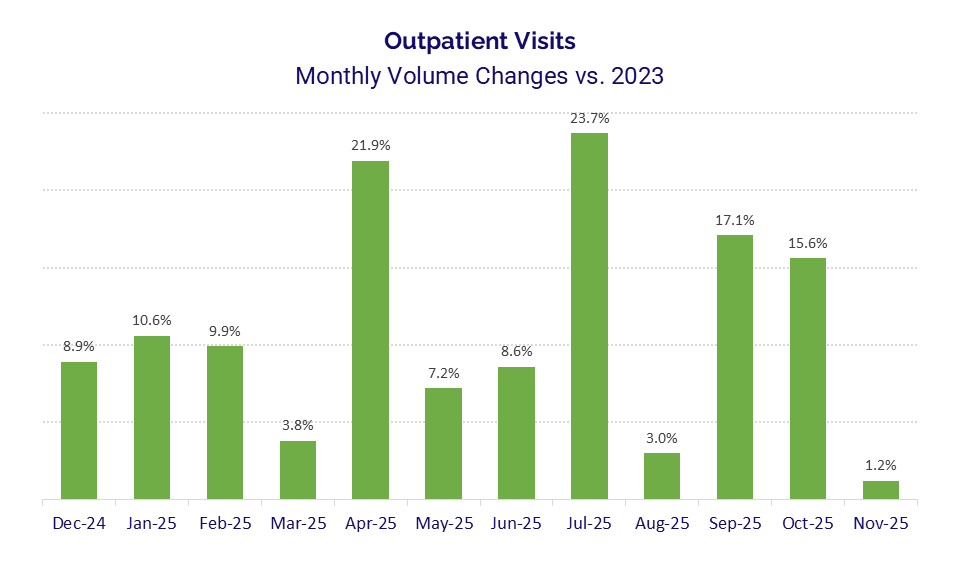
Hospital volumes: Patient demand was mixed in November, with YOY growth in inpatient volumes offset by declines across most other settings. Nationally, inpatient admissions increased 2.0% YOY, while outpatient visits decreased 0.2% YOY. Observation visits and emergency visits also were down, decreasing 1.5% and 2.8% YOY, respectively. Compared to November 2023, outpatient visits nationally increased 1.2%, while inpatient admissions rose 1.6%.
All metrics decreased month over month. Outpatient visits saw the largest sequential drop, falling 16.8% from October to November. Inpatient admissions declined 6.4%, while emergency visits and observation visits decreased 6.9% and 8.0% YOY, respectively.
By region, hospitals in the Northeast recorded the strongest YOY growth in inpatient admissions at 3.4%, followed by hospitals in the South at 2.9%. Changes in outpatient visits ranged from a decrease of 2.2% YOY for hospitals in the Northeast to an increase of 2.2% for those in the West.
Service line volumes: Patient demand remained positive across many service lines, with several specialties continuing to post strong YOY growth, according to the latest data from October. Ophthalmology again stood out as the fastest-growing service line, with patient volumes up 11.2% YOY. Hepatology also saw robust growth, increasing 9.9% YOY, while hematology volumes rose 8.4%. Additional areas of solid growth included cardiology (+6.3%), genetics (+6.1%), gastroenterology (+5.7%), and cancer services (+5.3%), reflecting broad-based strength across both medical and surgical specialties.
A smaller subset of service lines experienced volume declines. Infectious disease saw the steepest decrease, with patient volumes down 12.3% YOY, followed by normal newborn volumes, which declined 10.4%.
Procedure volumes: Among the 15 common procedure types tracked, a small number of inpatient and laboratory services continued to see demand declines. Inpatient primary knee replacements saw the steepest decline, falling 16.7% YOY, reinforcing the continued shift of joint replacement procedures toward outpatient settings. Inpatient primary hip replacements also declined, down 5.3% YOY.
Growth was led by outpatient imaging and diagnostic procedures. Outpatient positron emission tomography (PET) volumes increased 14.5% YOY, followed closely by outpatient upper gastrointestinal endoscopies at 14.1% YOY, and outpatient magnetic resonance imaging (MRI) at 12.0%. Overall, the data highlight ongoing strength in advanced imaging and outpatient diagnostics, offset by continued softness in select inpatient surgical procedures.
Children’s hospital volumes: Children’s hospitals saw declines across all metrics in November, reflecting seasonal and demand-related pressures entering the winter months. Inpatient admissions decreased 8.4% and outpatient visits fell 4.5% relative to November 2024. Observation visits were essentially flat YOY, edging down just 0.1%. Emergency visits saw the steepest decline, dropping 13.3% YOY, according to the latest data from November 30.
![]()

A look at last month’s key performance indicators from more than 10,000 physician practices.

Physician investments: Physician practices saw ongoing increases in the level of investment needed to support physician practices. The median investment per physician full-time equivalent (FTE) rose to $333,701 for November annualized, up 7.4% compared to 2024 and 18.0% versus 2023.
The metric increased for practices across all census regions. Practices in the Midwest reported the largest increase compared to 2024, with median investment per physician FTE rising 16.5% followed by practices in the South (9.9%), Northeast (9.0%), and West (7.4%). Compared to 2023, the South saw the biggest increase at 35.9%, followed by the West at 19.7%, the Midwest at 12.0%, and the Northeast at 11.6%.
Physician expenses: Rising expenses drove the increases in per-physician investments. The median total expense per physician FTE was approximately $1.1 million, representing an 8.2% increase compared to 2024 and a 17.5% increase versus 2023, underscoring persistent expense pressures across physician operations.
Expense growth was evident across all census regions. Practices in the Midwest experienced the largest YOY increase, with total expense per physician FTE up 11.7% compared to 2024. Practices in the South and Northeast also saw notable increases of 7.3% and 6.9%, respectively. The West reported more moderate growth, with expenses per physician FTE rising 3.3% YOY.
Physician revenues: Physician revenues continued to increase for November annualized. The median NPSR per physician FTE was $780,767. That marked a 6.8% increase compared to 2024 and a 15.4% increase versus 2023, reflecting continued revenue growth across physician practices even with rising expense pressures.
Regional results were mixed. Practices in the South posted the strongest growth compared to 2024, with median NPSR per physician FTE up 6.0%, followed by the Midwest at 4.2% and the West at 3.9%. In contrast, practices in the Northeast saw per-physician revenues decline 3.6% YOY. Compared to 2023, however, all regions experienced gains, ranging from 9.7% in the Northeast to 17.7% in the West.
Physician productivity and staffing: Physician productivity remained on the rise in November, while staffing levels declined. The median work relative value units (wRVUs) per physician full-time equivalent (FTE) reached 6,461 for November annualized, up 3.6% compared to 2024 and 9.2% above 2023 levels. At the same time, staffing levels trended downward. Median support staff FTEs per 10,000 wRVUs — a measure of staffing levels and productivity — declined to 3.4, down 4.3% versus 2024 and down 5.1% compared to 2023.


